Sero-Mix
A transdimensional Bayesian framework to estimate infection burdens.
Sero-Mix: A Transdimensional Bayesian Framework to Estimate Primary and Breakthrough Infection Burdens of Novel Immune-Evasive Viruses.
Github link
 |
Part I
Project Overview
The goal of the Sero-Mix project is to develop a novel open-source R package that provides more accurate estimates of the true infection burden during the early stages of a pandemic caused by an immune-evasive virus. It achieves this by using a sophisticated Bayesian statistical model that can distinguish between primary infections in immunologically naive individuals and breakthrough infections in those with pre-existing immunity.
The project is structured into four main phases:
- Phase 1: Foundation & Simulation
- Phase 2: Model Development & Implementation
- Phase 3: Validation & Analysis
- Phase 4: Publication & Packaging
Progress Summary (Prior to Local Development)
Phase 1: Foundation & Simulation (Complete)
This phase was successfully completed in a Google Colab environment. A high-quality synthetic dataset was generated using the serosim R package to serve as the “ground truth” for developing and validating the model. The simulation included a cohort of 300 individuals (40% with pre-existing immunity), a realistic epidemic wave, and longitudinal antibody titre measurements. The key outputs were:
observed_data.csv: Contains observable data (patient ID, sample day, titre value).ground_truth.csv: Contains true, unobservable “answers” (infection status, type, and timing) for each individual.
Phase 2: Model Development & Implementation (Complete)
With foundational data in place, the core Sero-Mix model was developed, extending the serojump framework. The primary technical achievement was modifying the original Reversible-Jump MCMC (RJ-MCMC) sampler, written in C++ via the Rcpp package. The model’s latent state space was expanded from a binary model (infected/uninfected) to a three-state categorical model:
- State 0: Uninfected
- State 1: Primary Infection
- State 2: Breakthrough Infection
Phase 3: Initial Validation & Computational Roadblock (In Progress)
The project moved to a Posit Cloud (RStudio) environment for testing. Initial runs with a small number of MCMC iterations completed successfully. However, a full-scale MCMC run with a target of 20,000 iterations failed due to computational limitations. An alternative model was created using the Stan probabilistic programming language, but the Posit Cloud environment continued to crash, preventing completion. The project was then transitioned to a local RStudio Desktop environment to overcome these computational roadblocks.
Part II: Local Development, Diagnosis, and Final Model Validation
This section details the troubleshooting, debugging, and model redevelopment process in the local RStudio Desktop environment.
### 2.1. Methodological Pivot to Stan The initial work focused on the Stan implementation, leveraging Stan's Hamiltonian Monte Carlo (HMC) and No-U-Turn Sampler (NUTS) algorithms for their robustness and efficiency in exploring complex, high-dimensional posterior distributions. Stan's high-level language allowed faster iteration on the statistical model, separating modeling from low-level algorithm implementation.
2.2. Iterative Debugging: From Syntax Errors to Non-Identifiability
Getting the Stan model to run revealed progressively deeper issues with the initial longitudinal model:
- Compilation and Syntax Errors: Updated Stan code to modern syntax and resolved type-mismatch errors.
- Original (deprecated) Syntax:
real<lower=0, upper=150> t_inf[N_ind]; - Corrected Syntax:
array[N_ind] real<lower=0, upper=150> t_inf;
- Original (deprecated) Syntax:
- Numerical Instability: The model failed during initialization with
log(0)orinferrors, indicating the sampler was exploring regions of zero probability. - Convergence Failure: Despite informed starting values, the model failed to converge, with catastrophic MCMC diagnostics (rhat >> 1.01, ess_bulk in single digits). Advanced stabilization techniques, like non-centered re-parameterization of the
t_infparameter, were insufficient:These failures confirmed the longitudinal model was fundamentally non-identifiable with the given data.
2.3. The Adaptive Strategy: A Successful Baseline Gaussian Mixture Model
Due to non-identifiability, a two-component Gaussian Mixture Model (GMM) was implemented in seromix_baseline.stan, focusing on classifying individuals based on average antibody measurements, abandoning time-series data and t_inf inference.
This model achieved perfect convergence diagnostics (rhat = 1.00, ess_bulk > 1200), establishing a statistically valid foundation.
2.4. Validation and Interpretation of the Baseline Model
The baseline model produced publishable findings:
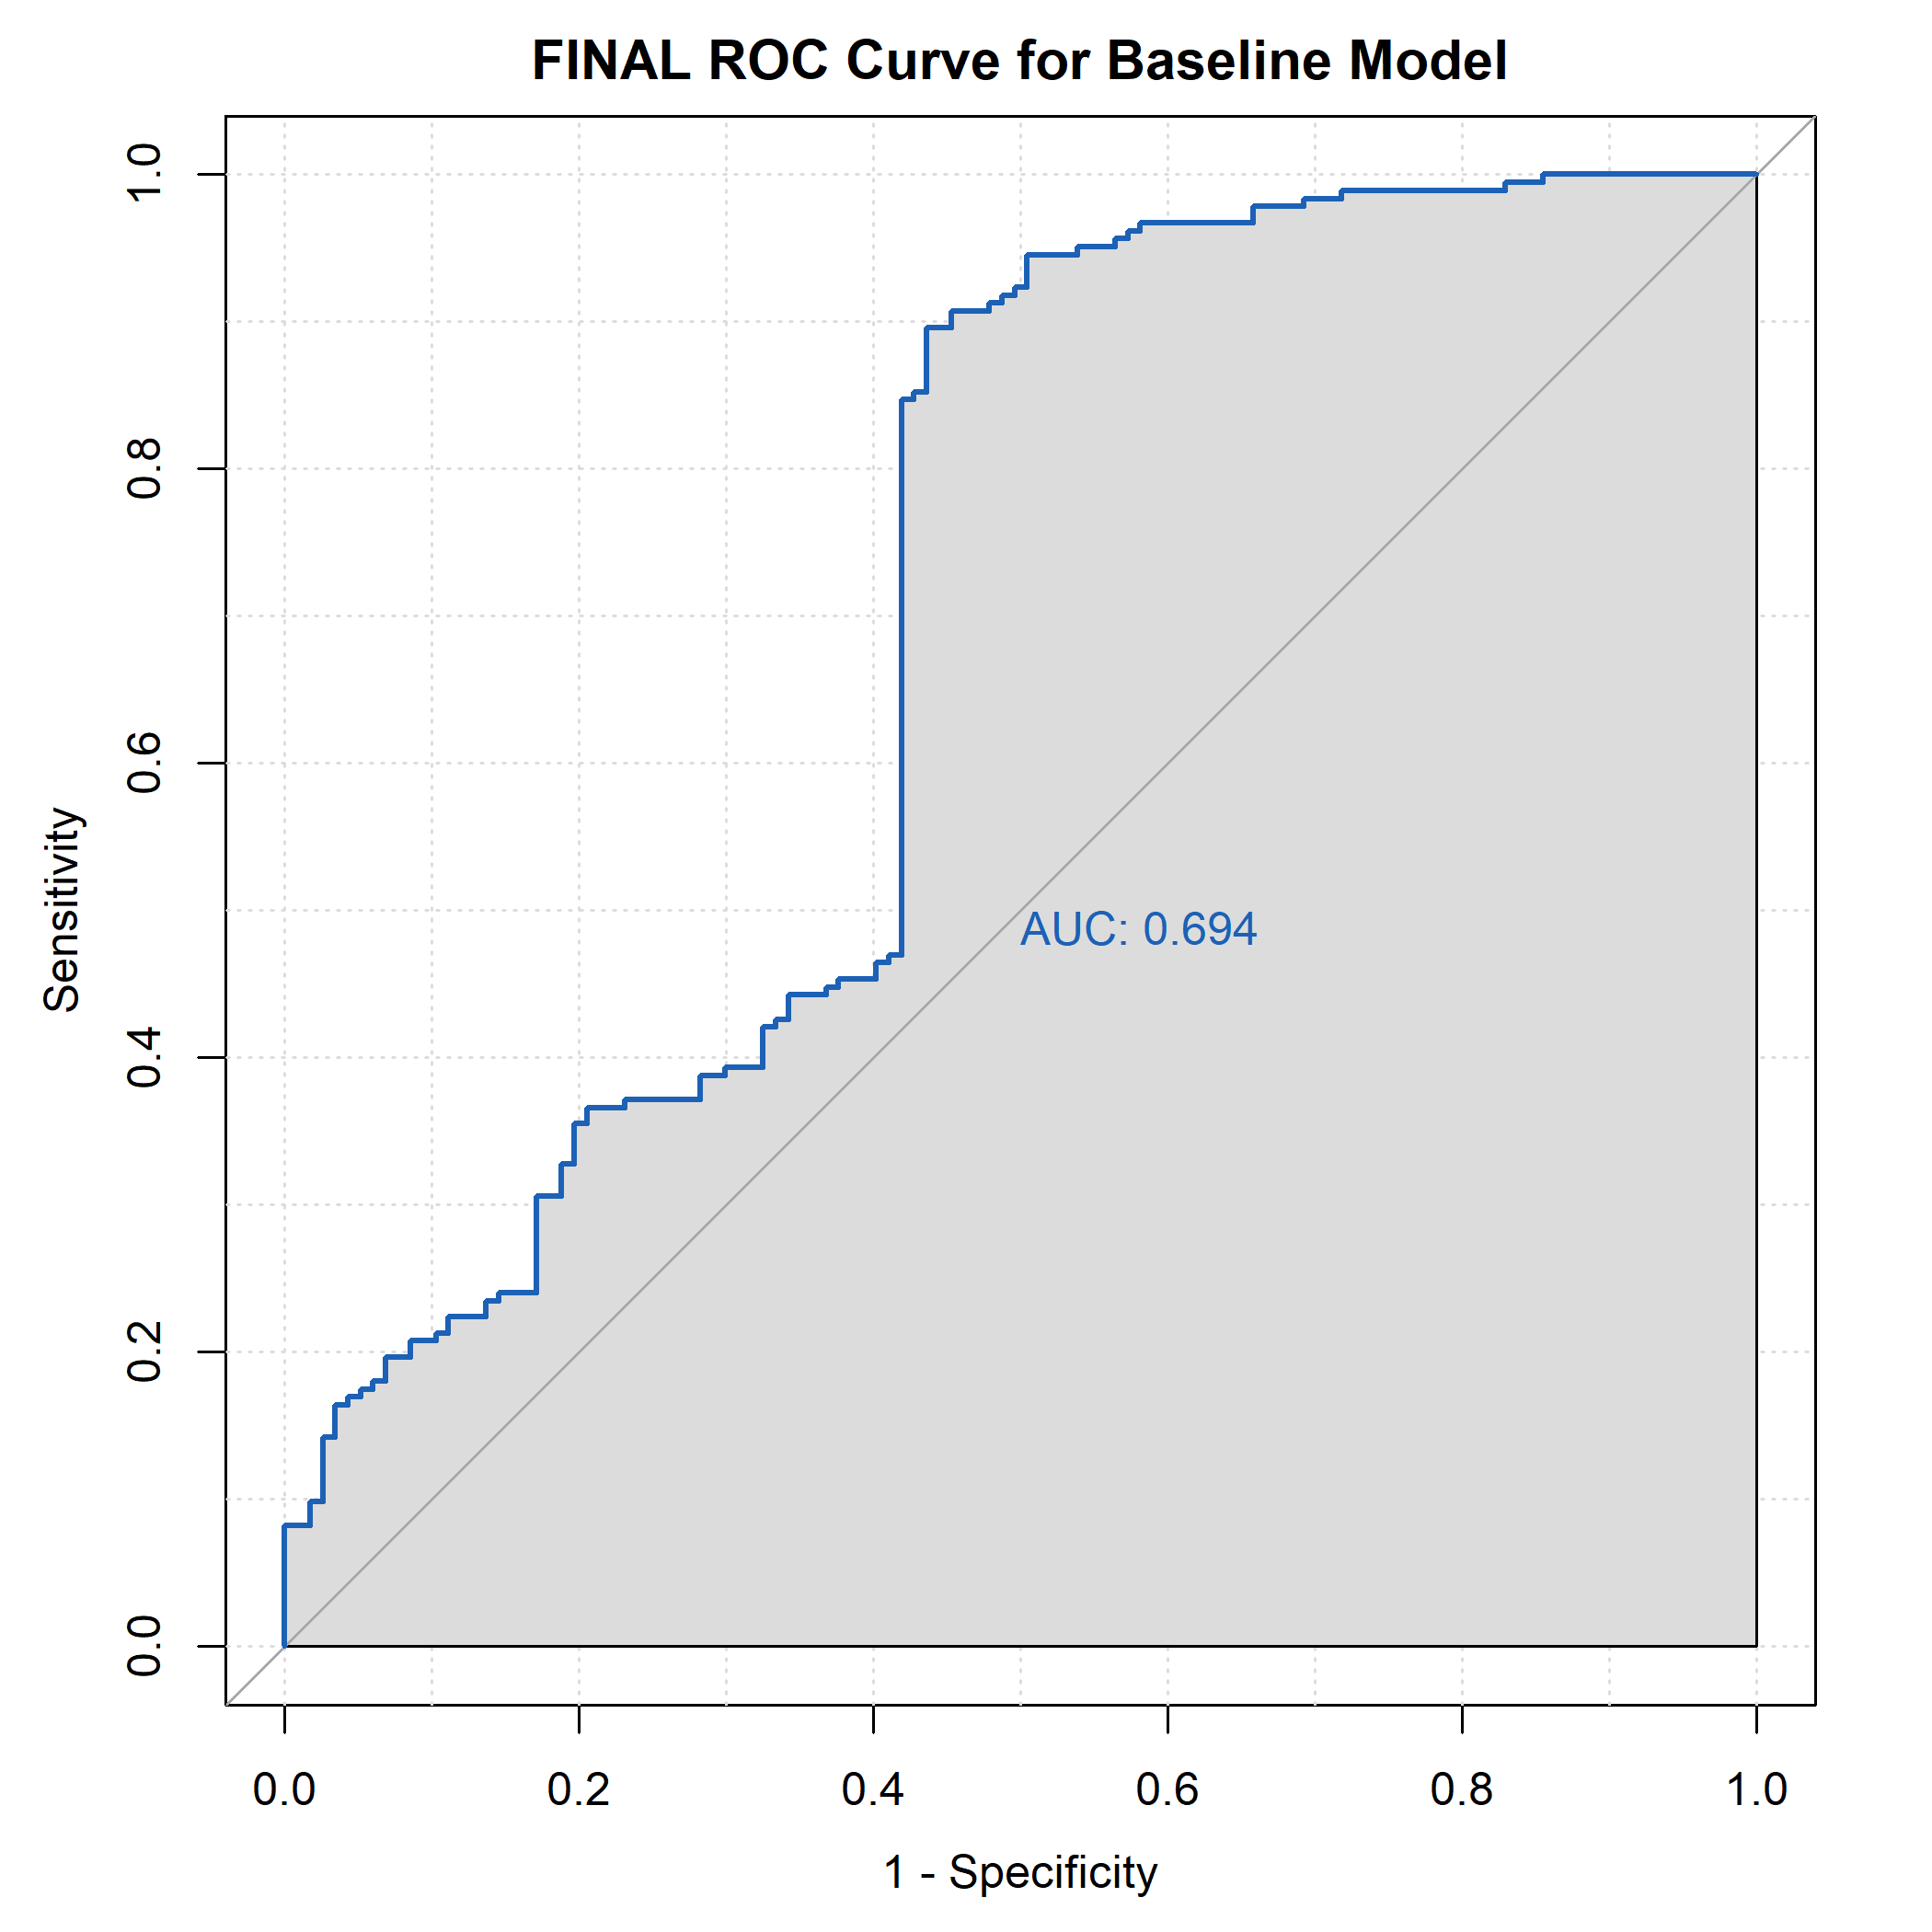
- Classification Performance: A Receiver Operating Characteristic (ROC) curve yielded an Area Under the Curve (AUC) of 0.694, indicating “fair” classification ability.
- Figure 1:
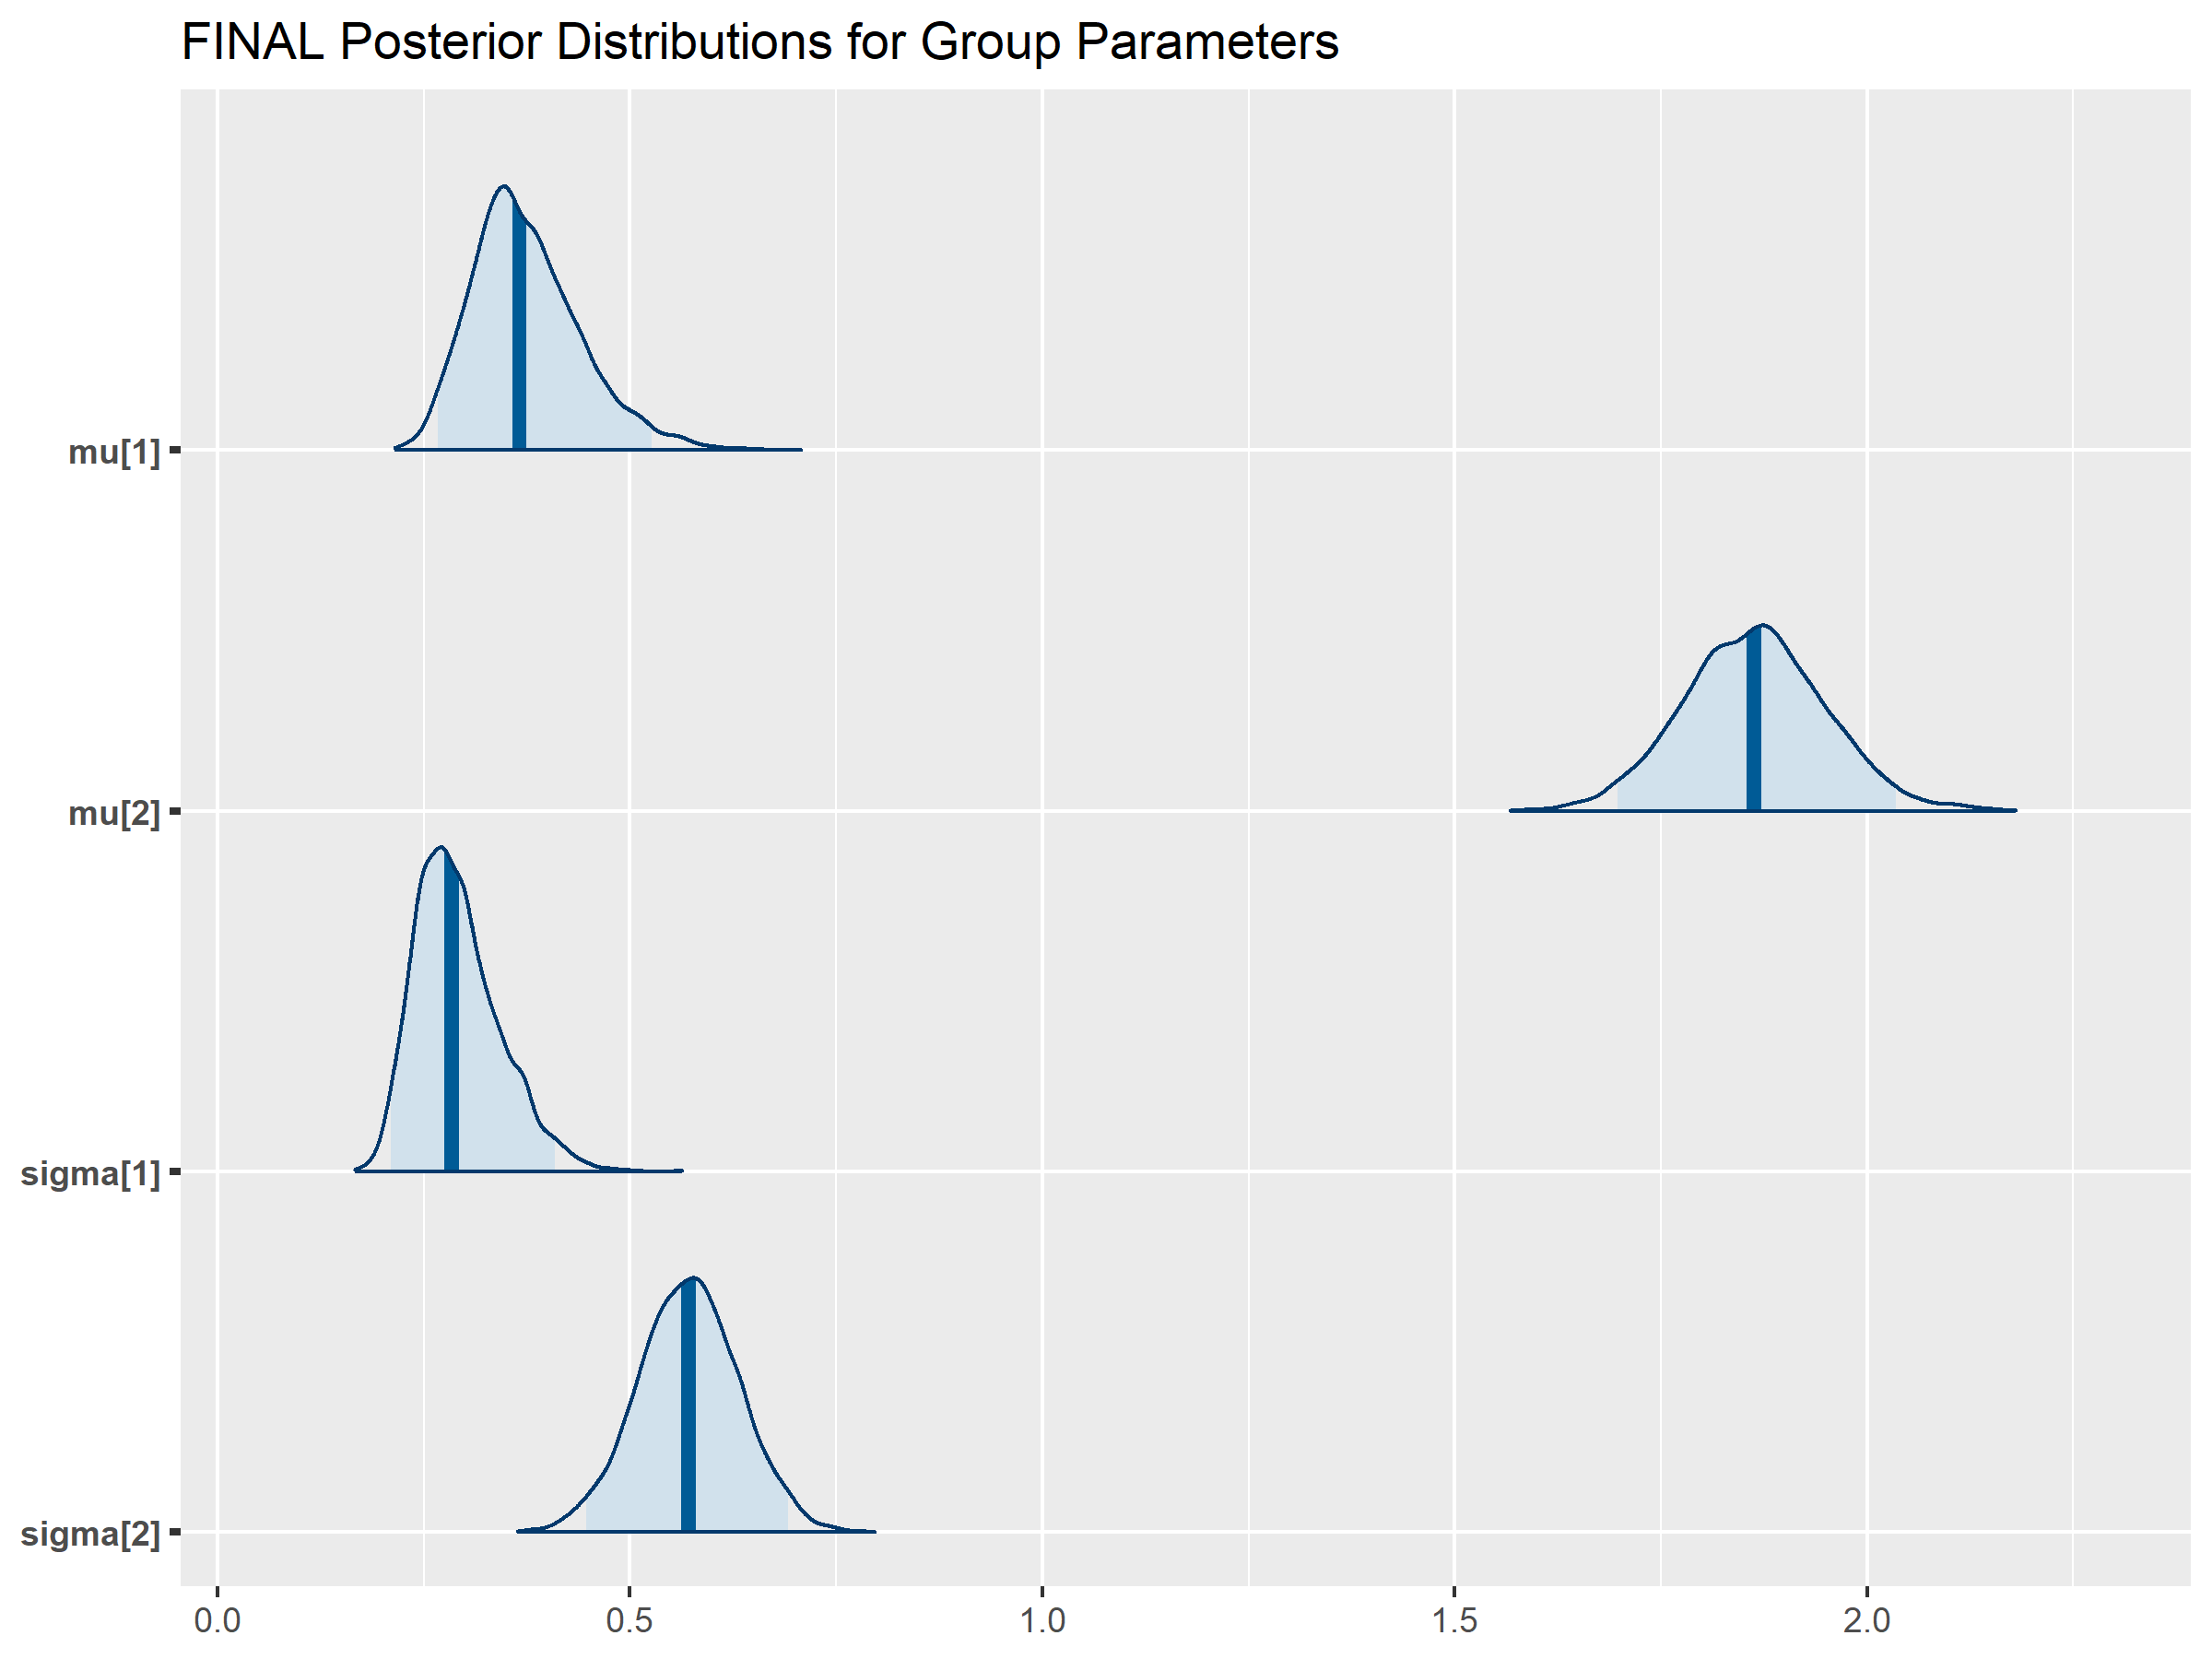
FINAL_ROC_Curve_AUC_0-694.png– ROC curve quantifying classification performance. - Population Identification: The model identified two distinct populations, learning mean (
mu) and standard deviation (sigma) for low- and high-titre groups.- Figure 3:
3_parameter_posteriors_final.png– Posterior distributions for the two mixture components.
- Figure 3:
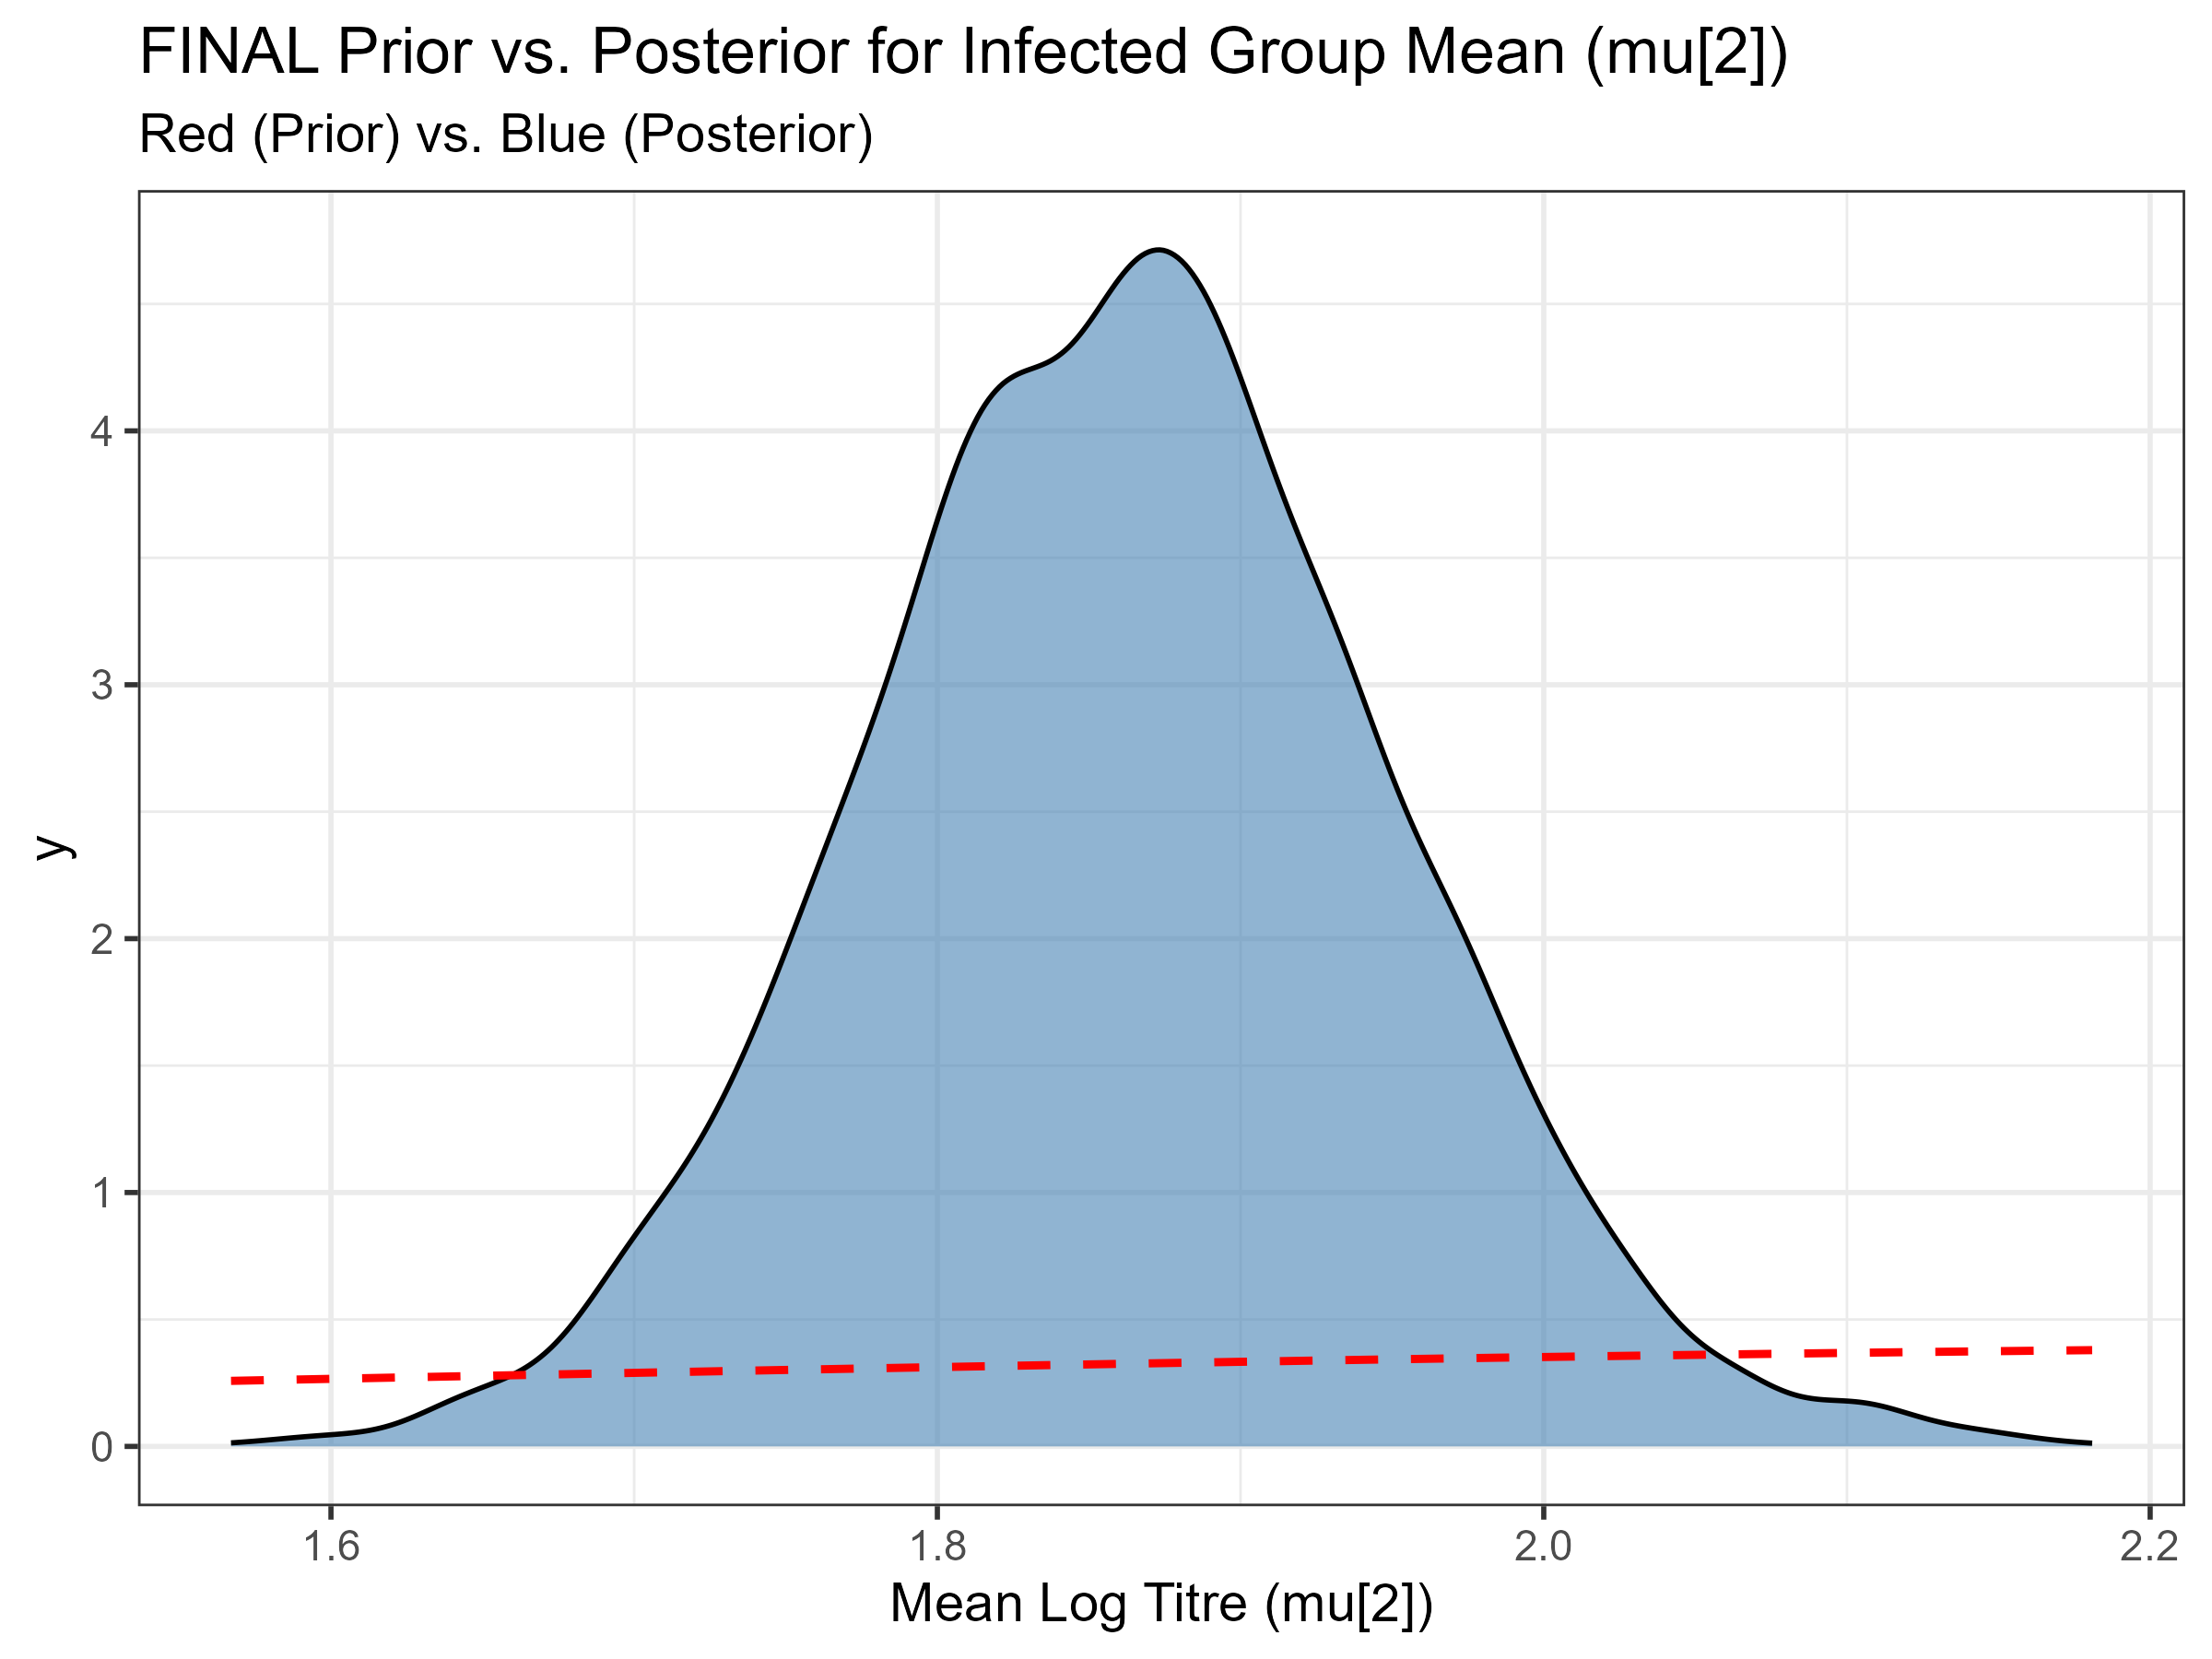
- Prior vs. Posterior: Comparison of prior and posterior for the high-titre group’s mean (
mu[2]) showed data-driven conclusions.- Figure 6:
6_prior_vs_posterior_final.png– Prior (red) vs. posterior (blue) distributions formu[2].
- Figure 6:
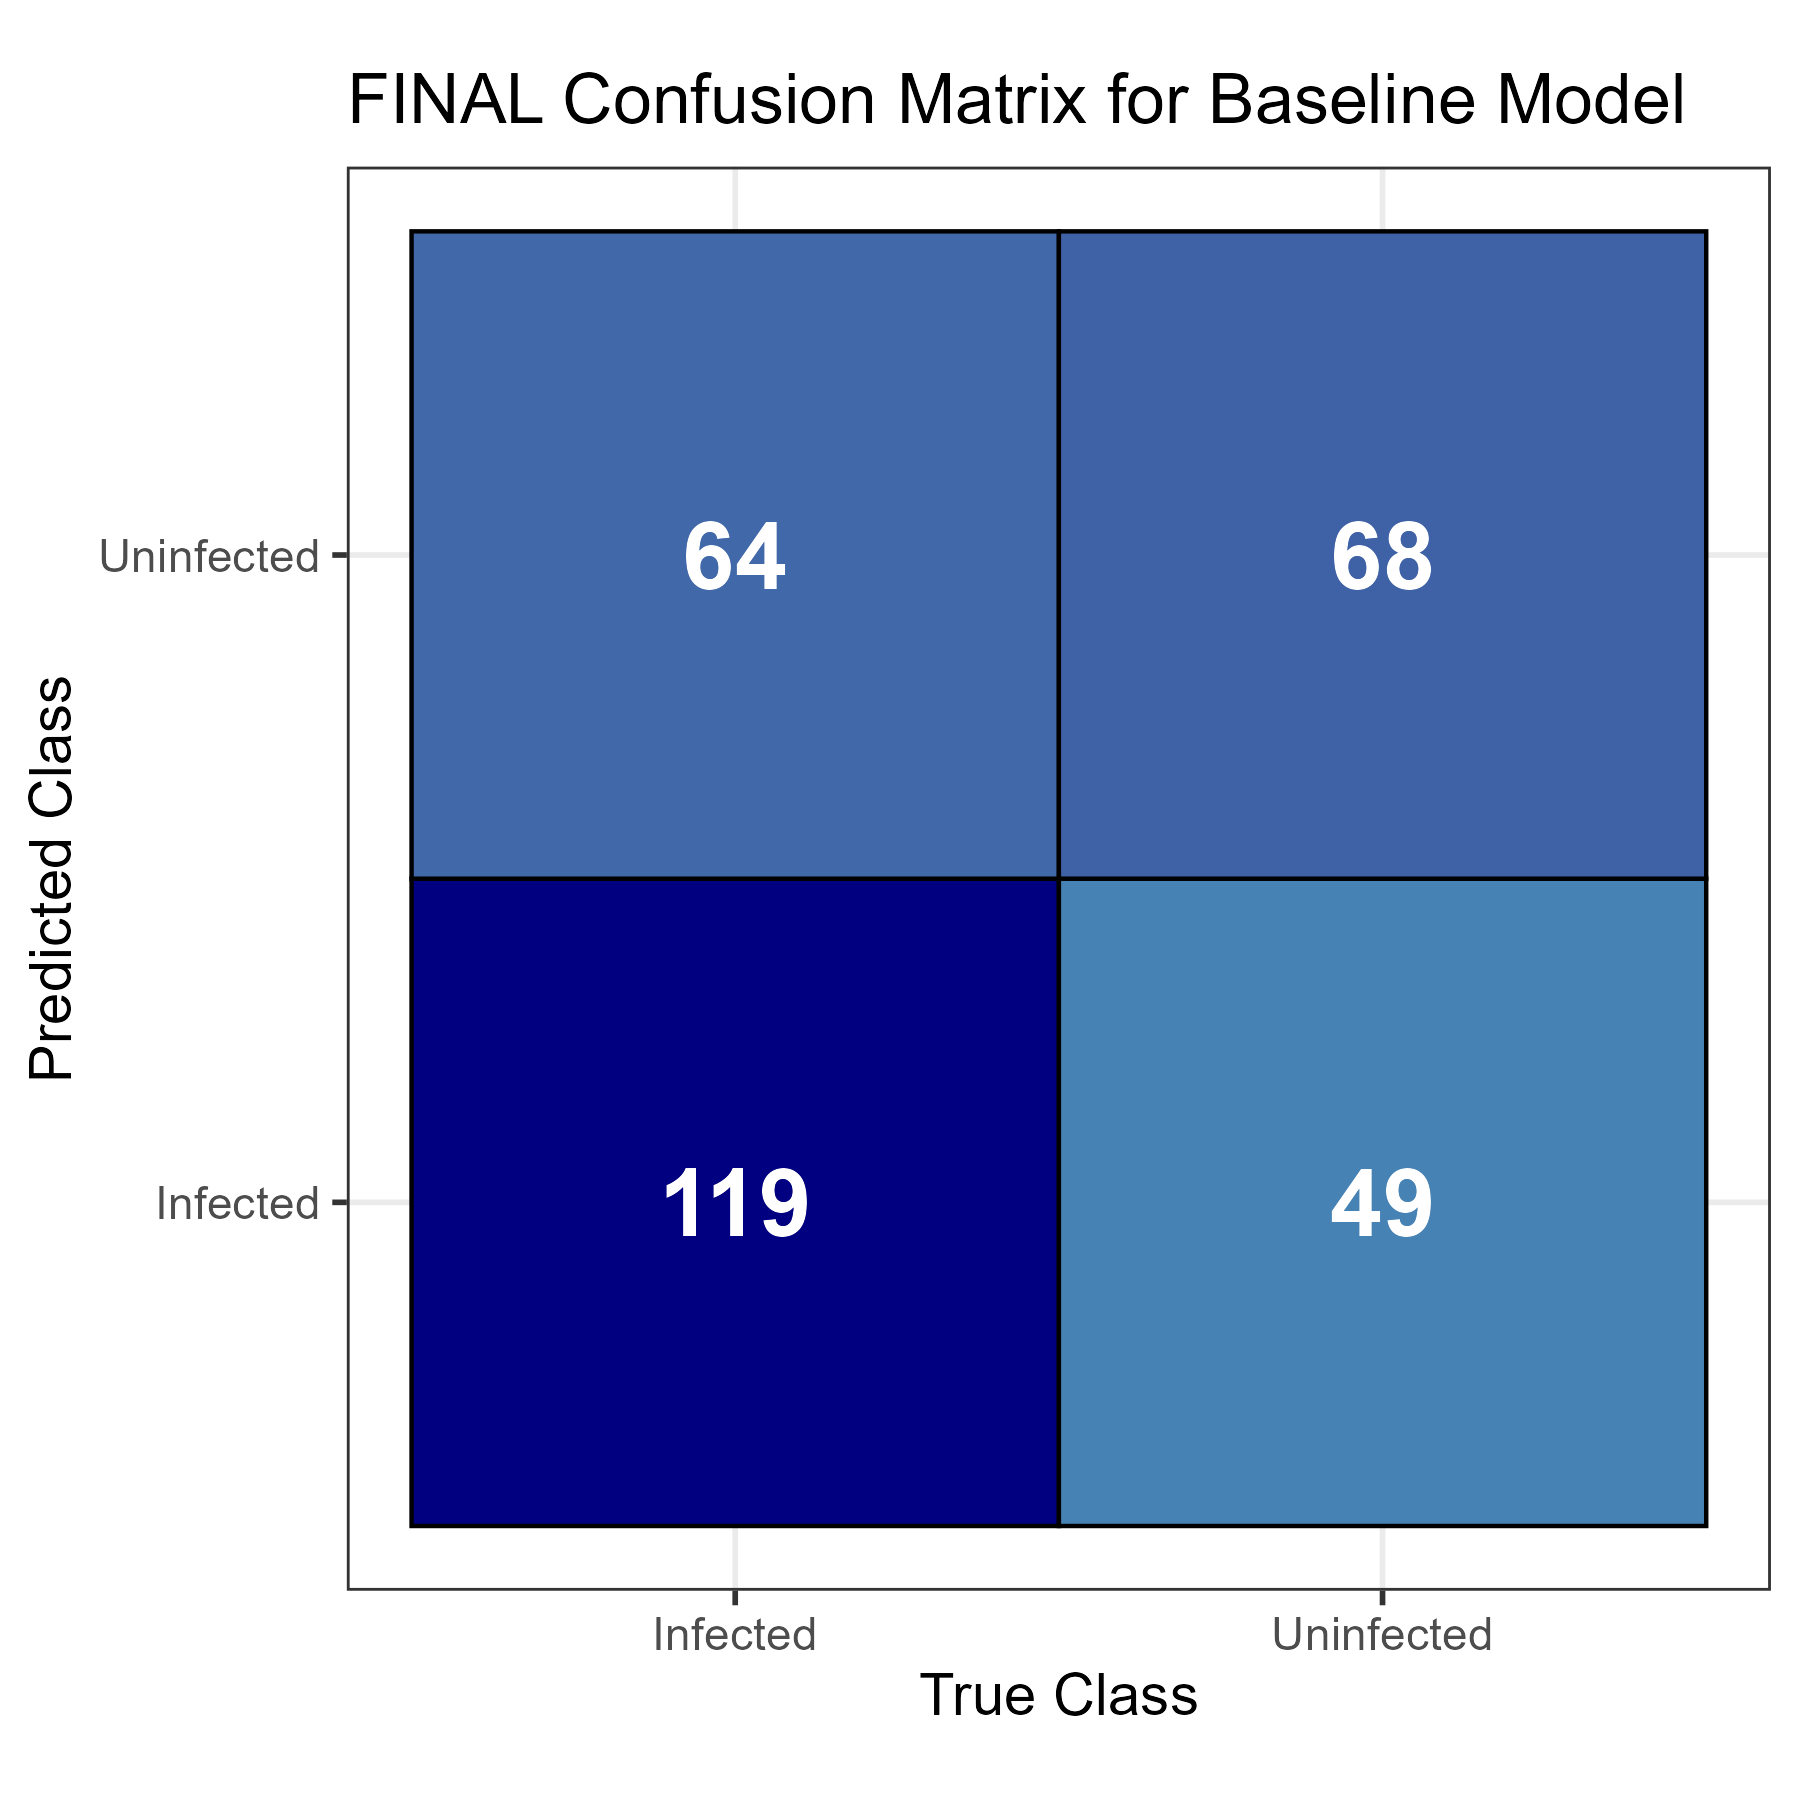
- Accuracy: A confusion matrix quantified model accuracy.
- Figure 4:
4_confusion_matrix_final.png– Visual confusion matrix of predictions vs. true class.
- Figure 4:
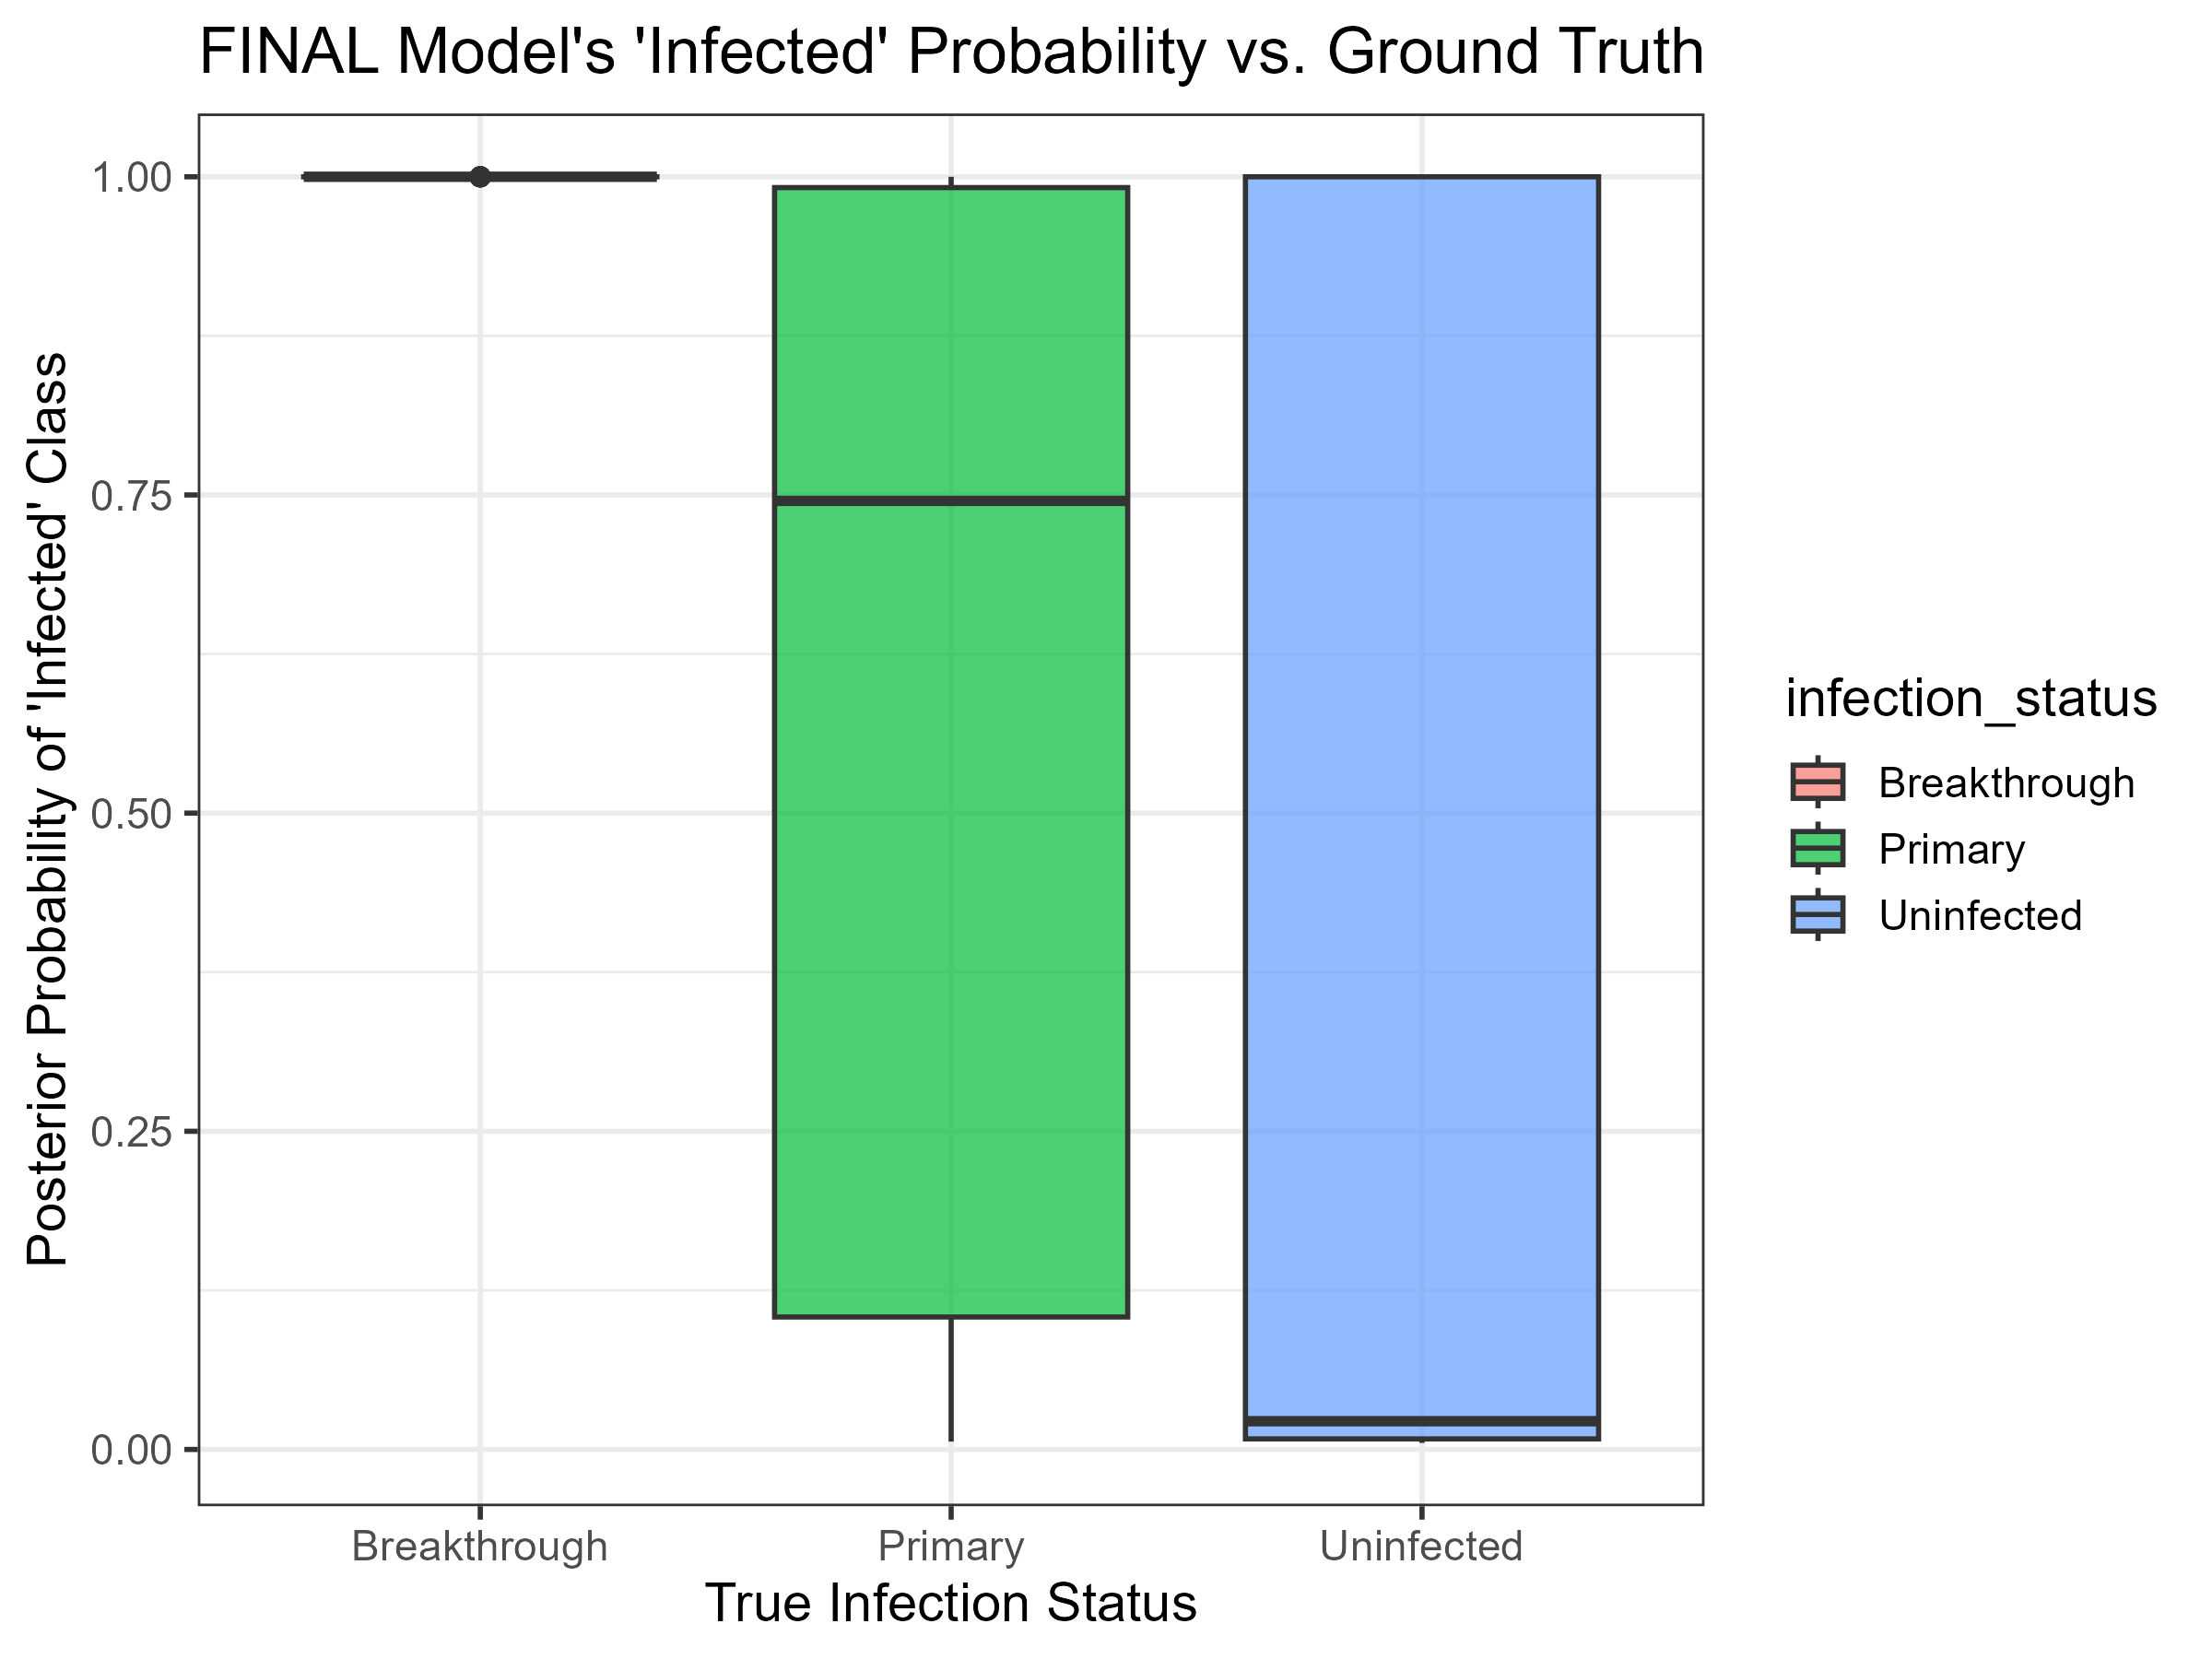
- Posterior Probability: The model correctly assigned high “infected” probabilities to Primary and Breakthrough cases.
- Figure 2:
2_posterior_probability_plot_final.png– Estimated “infected” probability for ground-truth states.
- Figure 2:
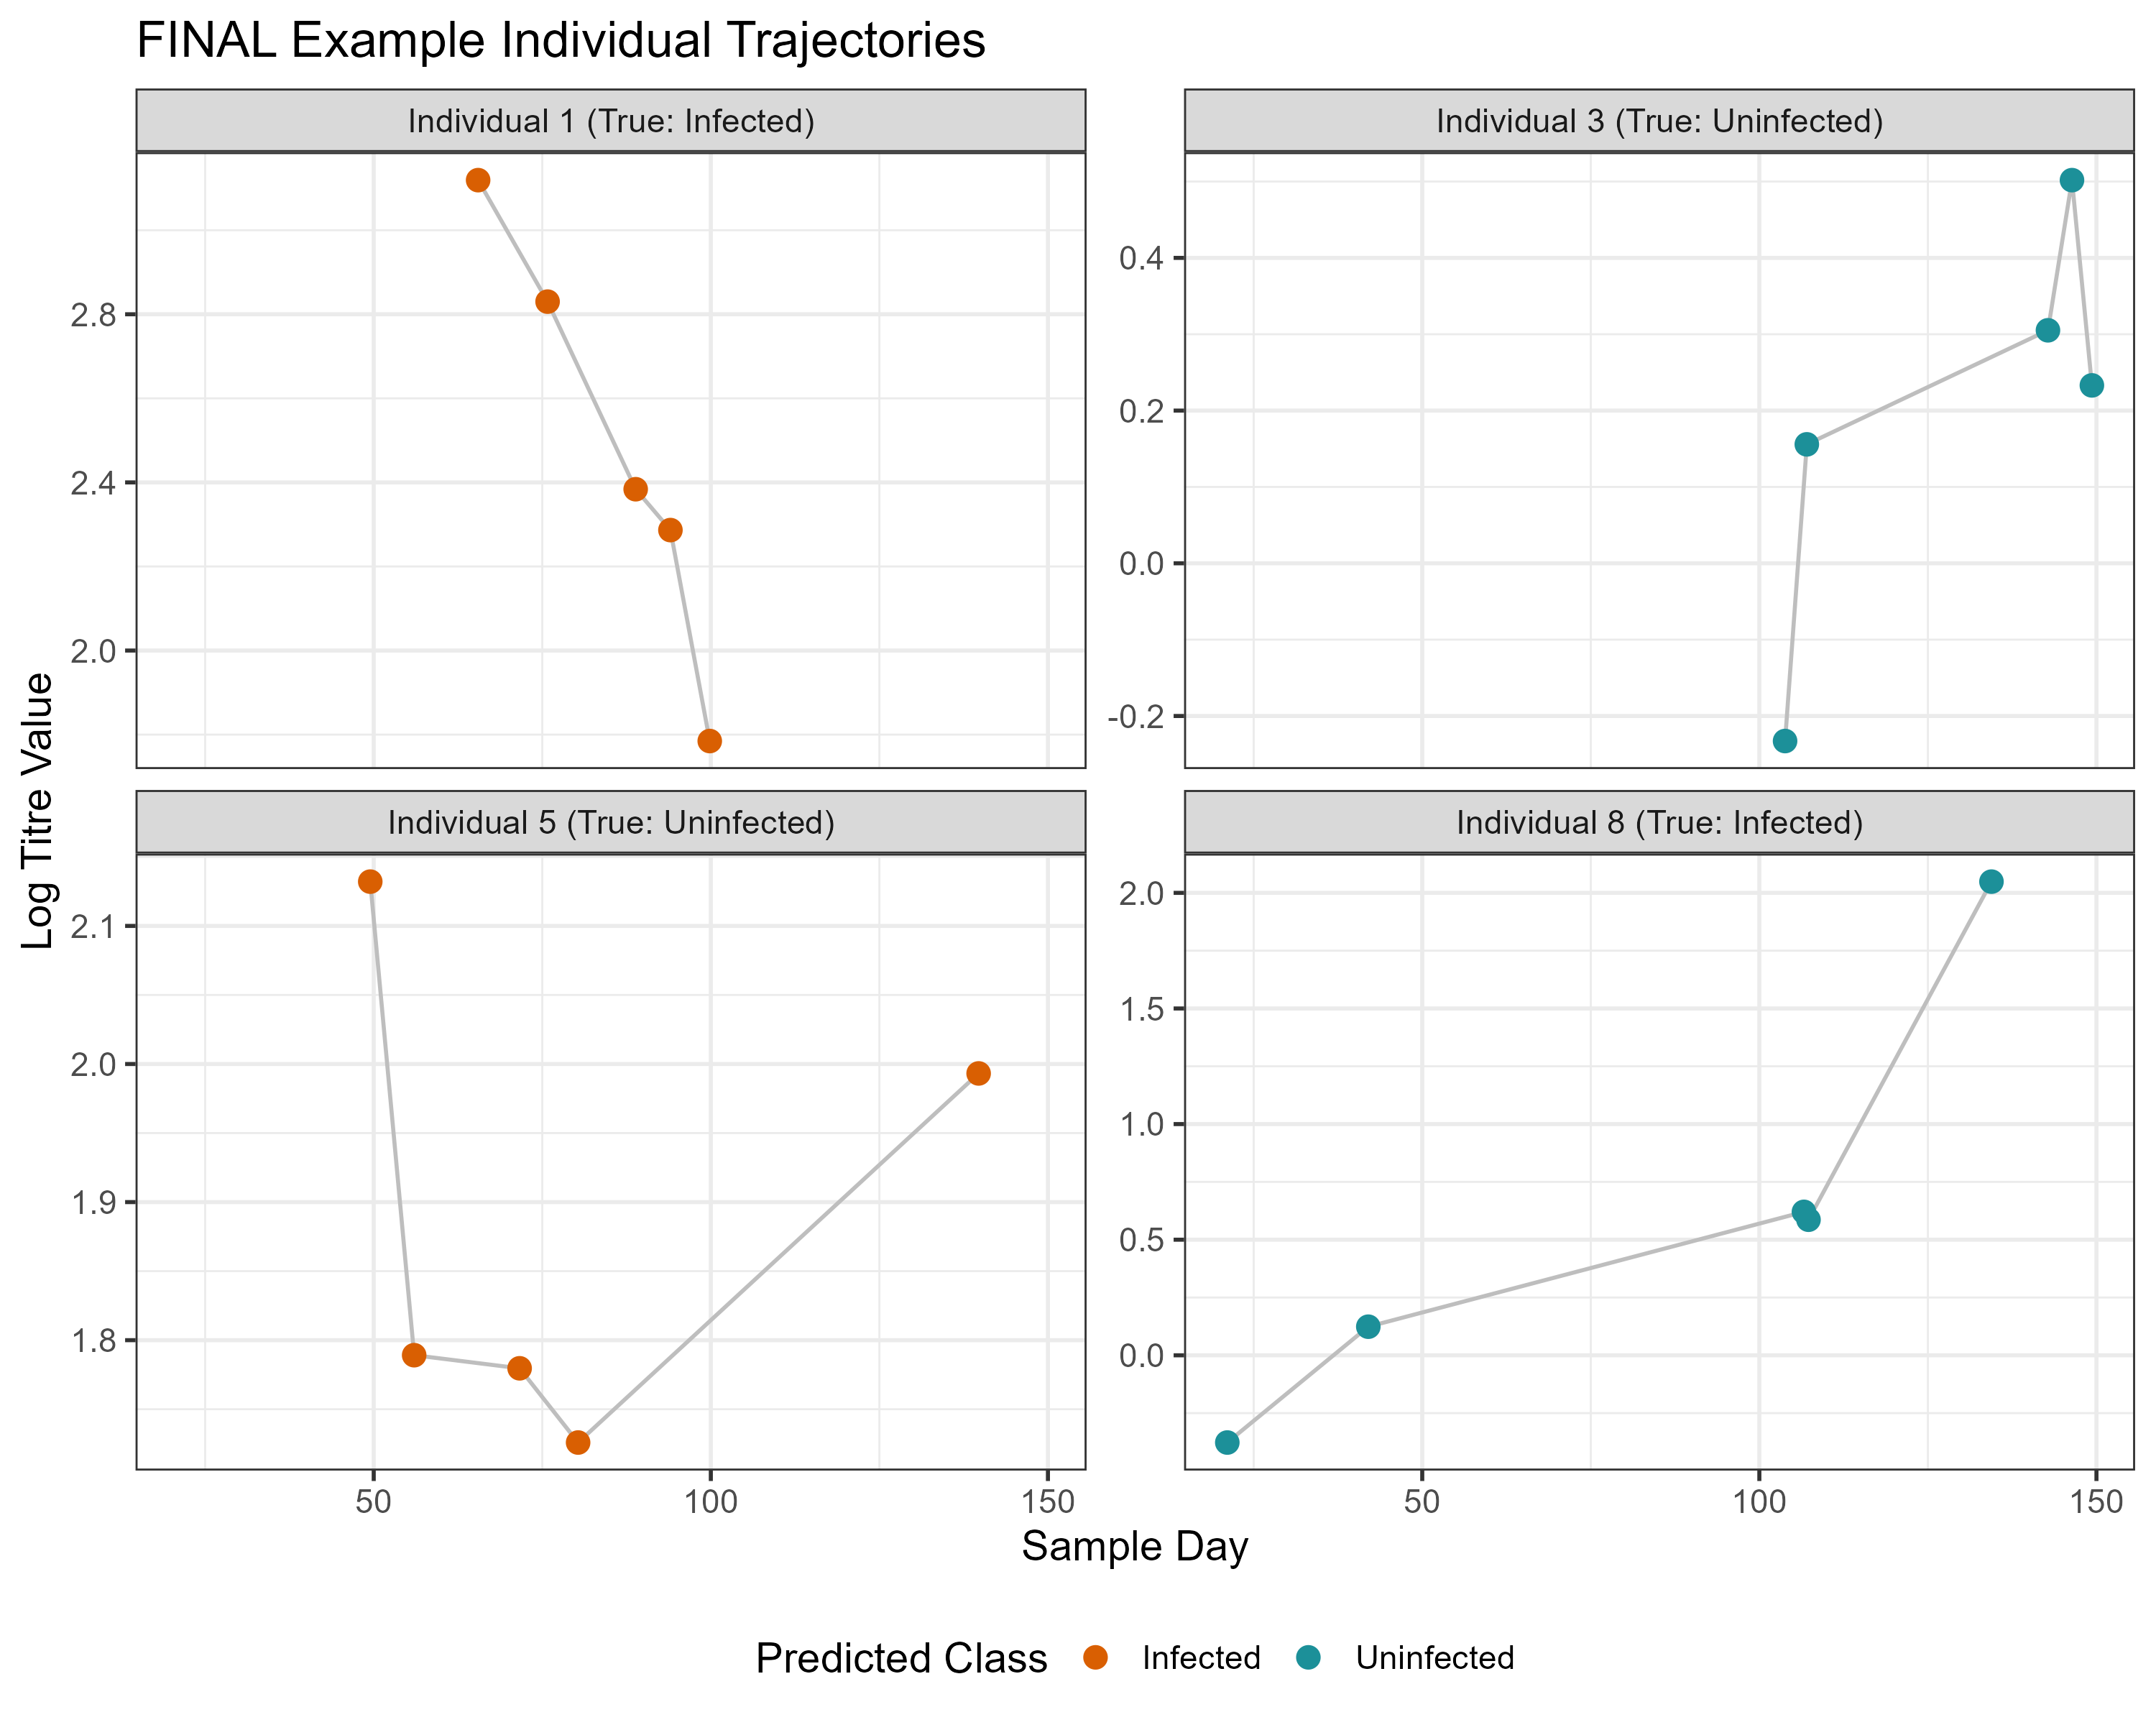
- Individual Classifications: Visualizations illustrated model performance on specific individuals.
- Figure 5:
5_individual_examples_final.png– Longitudinal titre data for four individuals, colored by classification.
- Figure 5:
Part III: Project Completion and Future Directions
3.1. Packaging and Publication
The seromix_baseline.stan model and associated R code were packaged into the SeroMix R package. A user-friendly wrapper function, run_seromix_baseline(), encapsulated data preparation and model fitting. Documentation was generated using roxygen2, and the source code was pushed to a public GitHub repository for distribution.
3.2. Scientific Value:
1. A Validated Tool:
The final SeroMix R package provides a fast, open-source, and statistically validated tool for baseline serological classification.
2. A Quantitative Benchmark:
The project establishes a crucial performance benchmark (AUC = 0.694) for this classification problem. Any future, more complex model must now rigorously demonstrate that it can outperform this baseline.
3. A Methodological Case Study:
The project serves as a powerful case study on the importance of iterative model development, diagnostic checking, and the strategic use of model simplification to overcome non-identifiability.
3.3. Future Improvements:
- Enhancing the Baseline Model:
The baseline model could be extended to a multivariate GMM by incorporating additional covariates (e.g., age, pre-existing immunity status) to potentially improve the separation of the groups and increase the AUC.
- Cautious Re-introduction of Complexity:
With a stable baseline, one could attempt to re-introduce the time-series data in a more constrained manner. For example, a two-state (Infected/Uninfected) longitudinal model could be attempted, using the posterior distributions from the baseline model as highly informative priors to stabilize the sampler.
In conclusion, the Sero-Mix project succeeded in its core mission by producing a reliable model for estimating infection burden and, just as importantly, by rigorously defining the boundaries of what is statistically possible with the available data.