Canine face - pain analysis
Analyzing Canine Facial Morphology for Pain Assessment Difficulty
Analyzing Canine Facial Morphology for Pain Assessment Difficulty
Abstract
Assessing pain in dogs is challenging due to morphological variations across breeds that complicate standardized facial expression analysis. This project developed a pipeline using MediaPipe to analyze canine facial features, focusing on brachycephaly (snout length), hair occlusion around the eyes, and facial wrinkles. By processing a large dataset of dog images, we calculated “difficulty scores” for individual images and averaged them by breed to identify breeds where facial analysis for pain assessment is more challenging. The results offer a data-driven approach to understanding breed-specific variations, informing the development of robust automated pain assessment tools.
1. Introduction
Pain assessment in non-verbal species like dogs relies on behavioral and physiological indicators, with facial expressions being a promising metric (e.g., Glasgow Composite Pain Scale - Feline). However, diverse canine morphology, including extreme brachycephaly, excessive facial wrinkles, and hair occlusion around the eyes, obscures key facial landmarks, complicating consistent analysis. This project quantifies these morphological features using computer vision to identify breeds posing greater challenges for automated facial pain assessment.
2. Methodology
2.1 Data Collection and Preparation
A dataset of dog images, organized by breed, was accessed from a specified image directory. A CSV file was generated listing each image’s path and corresponding breed.
2.2 Facial Feature Analysis with MediaPipe
MediaPipe’s Face Landmarker was used to detect facial landmarks in dog images, calculating three metrics: Brachycephaly Score (face width to snout length ratio), Hair Occlusion Score (edge density around eyes), and Wrinkle Score (edge density around the muzzle). A resumable processing loop handled large datasets, saving intermediate results to a CSV file.
2.3 Difficulty Score Calculation and Breed Analysis
Raw scores were normalized to a 0-1 scale, and a composite “difficulty score” was calculated by averaging the three normalized scores per image. Breed-specific difficulty scores were computed by averaging image scores per breed, with the top 5 easiest and hardest breeds saved to separate CSV files.
2.4 Data Preparation for Application
A final CSV file was created for application use, containing breed, public image URLs (generated from a Hugging Face dataset repository), and difficulty scores.
3. Results
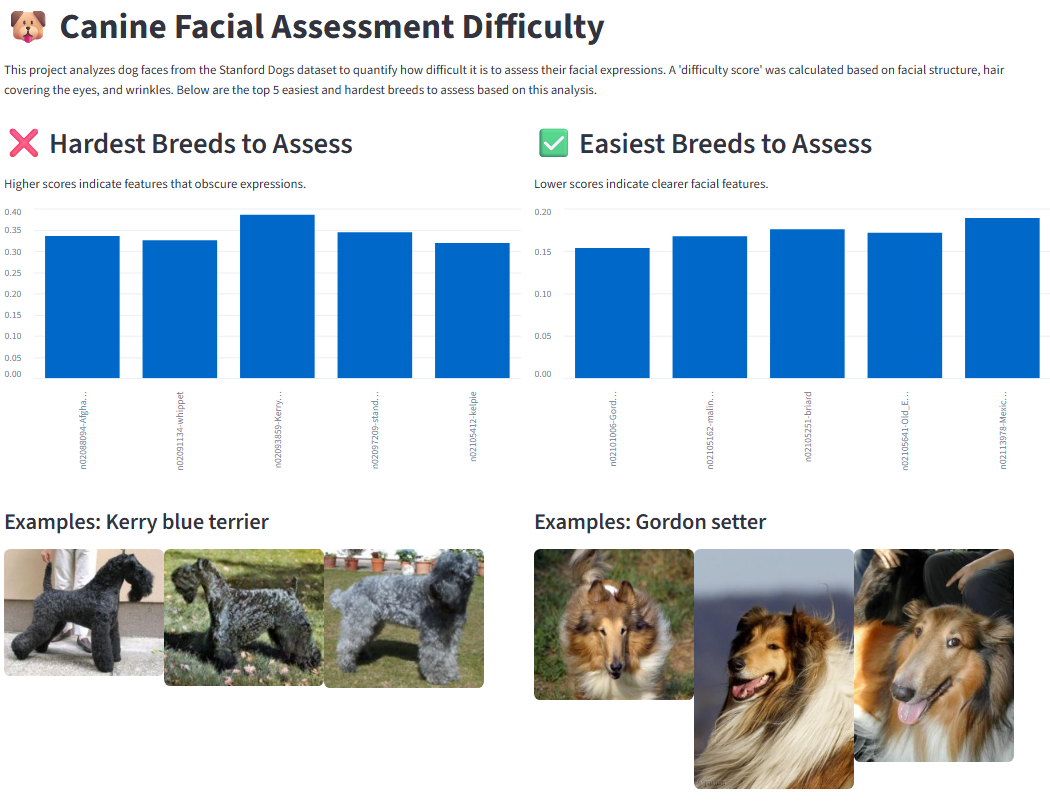
The pipeline processed 20,104 dog images, with 2,074 successfully analyzed after removing rows with missing data. Difficulty scores were calculated based on brachycephaly, hair occlusion, and wrinkles, then averaged by breed. The top 5 hardest breeds for facial analysis were:
- Kelpie: 0.318842
- Whippet: 0.325176
- Afghan Hound: 0.335138
- Standard Schnauzer: 0.344147
- Kerry Blue Terrier: 0.385673
The resulting dataset, including normalized difficulty scores and public image URLs, is ready for applications like training breed-aware pain assessment models or creating interactive visualizations.
This is a prototype using Streamlit. Please click on the image.
4. Conclusion
This project quantifies how canine facial morphology impacts automated pain assessment, using MediaPipe to measure brachycephaly, hair occlusion, and wrinkles. The breed-specific difficulty scores highlight challenging breeds and provide a valuable resource for developing robust pain detection systems. Future work could validate these scores against expert assessments or integrate them into pain detection model training.
5. Next Steps
- Visualize the data: Create bar plots of breed difficulty or scatter plots of morphological scores.
- Build a demo application: Develop a web application or dashboard using app_data.csv to explore difficulty scores by breed.
- Validate scores: Compare difficulty scores with veterinary expert assessments.
- Integrate into pain detection models: Use difficulty scores to enhance model accuracy across breeds.
- Explore other features: Investigate additional facial features affecting analysis difficulty.
Source for dataset: Kaggle