Crohn-iPI: An Interactive Dashboard
Crohn-IPI_Dashboard
Crohn-iPI: An Interactive Dashboard for Visualizing AI Attention on Endoscopic Images
Summary
This project developed an interactive dashboard to visualize and debug a machine learning model’s visual reasoning on endoscopic images using the Crohn-iPI dataset. The tool employs Grad-CAM to highlight areas of AI focus and compares model predictions with actual image classifications. The project demonstrates a complete machine learning pipeline, from data preparation to dashboard deployment, and reveals insights into model interpretability through a case of misclassification.
Introduction
Deep learning in medical imaging offers great potential but is hindered by its opaque decision-making process. The Crohn-iPI dashboard addresses this by visualizing a Convolutional Neural Network’s (CNN) attention, fostering trust and enabling critical analysis of model performance through clear visual representations.
Materials and Methods
The project used the Crohn-iPI dataset, containing 3,484 endoscopic images labeled with seven lesion types. Development utilized Google Colab and TensorFlow/Keras. A transfer learning approach with MobileNetV2 was employed, freezing the convolutional base and adding new classification layers fine-tuned on the dataset.
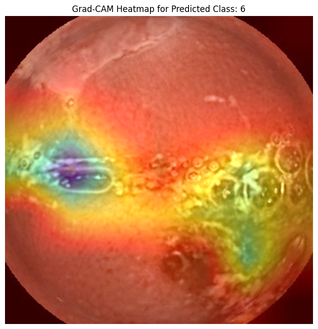
Grad-CAM was implemented to generate heatmaps highlighting critical image regions for model predictions, overlaid using cv2 for visual comparison.
Grad-CAM Classification
Results
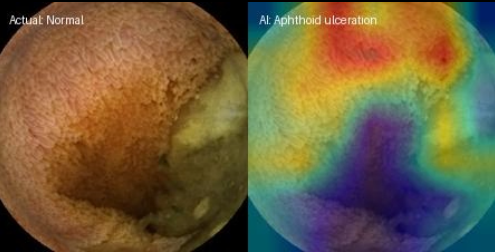
The dashboard successfully displays images alongside AI-generated heatmaps and actual labels. A notable finding was the model’s misclassification of a normal image as “Aphthoid ulceration,” with the Grad-CAM heatmap revealing erroneous focus areas, underscoring the importance of interpretability for diagnosing model errors.
Heatmap comparison
Conclusion
The project highlights model hallucination, as seen in the misclassification of a normal endoscopic image as “Aphthoid ulceration.” Grad-CAM heatmaps illustrate the AI’s incorrect focus, emphasizing the need for interpretability tools. To address misclassification, retraining with a balanced dataset and fine-tuning the model’s top layers are recommended. Common issues like insufficient data, imbalanced datasets, and overfitting were identified as potential causes of poor model performance.
Why Models Train Badly 🤷
- Not Enough Data: The model might not have had enough examples of specific, rarer lesions to learn their unique characteristics.
- Imbalanced Data: The dataset likely has far more images of normal tissue than it does of rarer lesions, causing the model to be biased toward the most common class.
- Overfitting: The model may have memorized the training images instead of learning the general features of a lesion, performing well on the practice data but failing on new, unseen images.